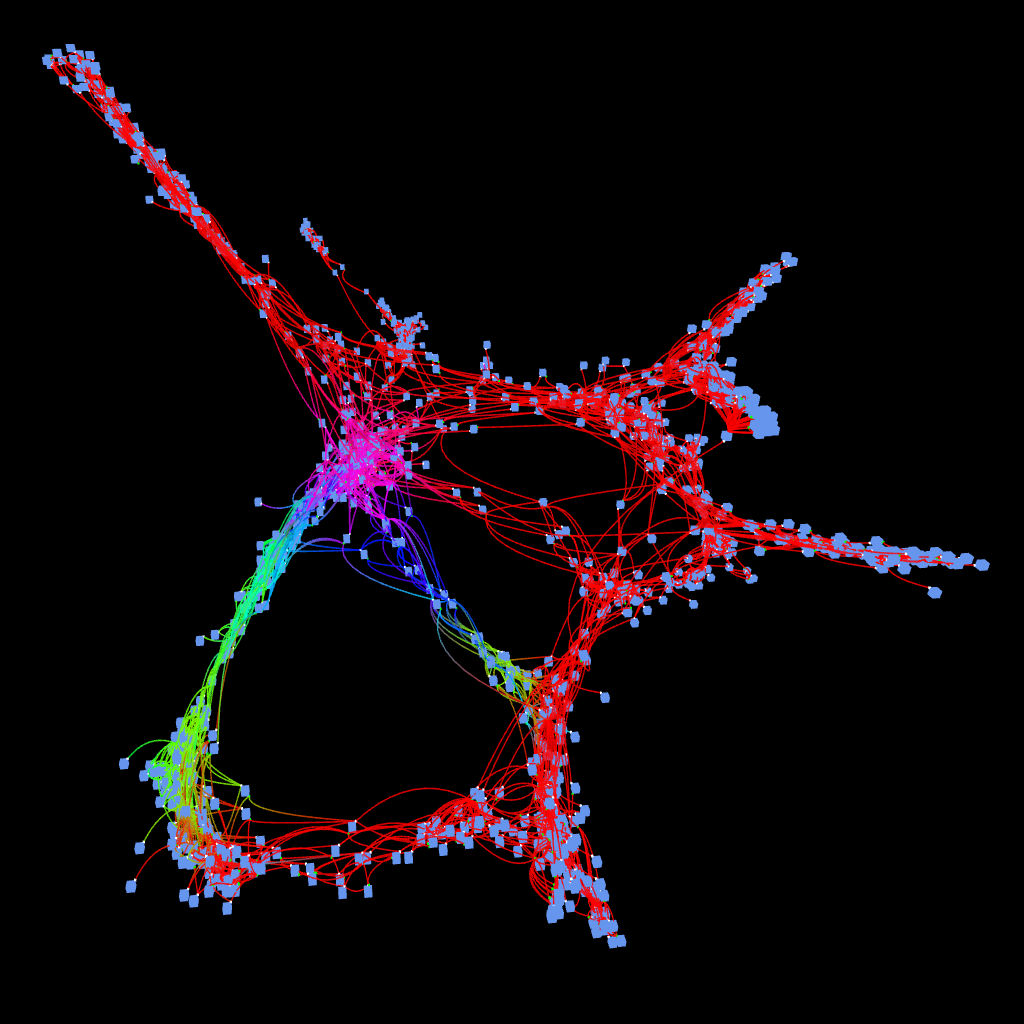
The Interactive Genome Graph Explorer is a browser-based system for visualizing and analyzing genome graphs in three dimensions. The tool will take node-edge graph layouts in JSON generated from Graphviz and visualize them with their approprite node data included. Nodes can be selected and shifted around. The visuals of the nodes and edges can be tweaked to find the best looking representation of the graph. Work is being done on direct conversion from .gfa formats, skipping the need for using Graphviz. Collaboration with UCSC GI. The system will run on any modern browser, including support for mobile devices.